As an entrepreneur, the success of your business is (we assume) of central importance. Starting a business is not just something small, instead it is a significant investment, not only of money but time, effort, emotion, stress and more.

Small business owners and freelancers usually have a lot on their plates. You’re likely constantly juggling the different aspects of running a business. What that means on a day-to-day level is that you’re looking for the most efficient ways of staying on top of things.
It’s one thing to be able to create, send, and manage invoices with invoicing software, as well as register payments and expenses. But what about the bigger picture? You don’t want to have to sit down and do calculations while on the go.
Numbers at a glance
The first time you log in to your Debitoor account, you’ll likely see an area with an empty graph. This will start to change quickly as you begin using your account. The graph updates automatically according to the amounts you enter - both incoming and outgoing.
These graphs can be customised slightly according to which details are most important for you to be able to see quickly, either from the mobile app or from a computer browser.
Graphs on your Home screen
The graphs that appear front and centre every time you log in to your account can be adjusted to a degree to allow you to see the data from your business over a certain time period.
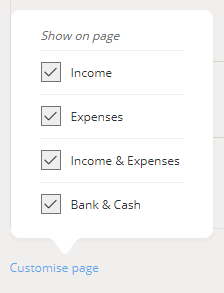
You can also choose which graphics appear on your homepage by clicking ‘Customise’ at the lower right and selecting or un-selecting the boxes for each graphic.
For two of the graphs, you can then also select a particular time period to view instantly. You can choose from either:
- This month
- Last 30 days
- Last 3 months
- Last 12 months
- Year to date
Changing the range will instantly update the graphs to that time period as default for that graph. Of course, this can be changed at any time.
The three graphics that you can add or remove from your dashboard are:
1. Income bar graph
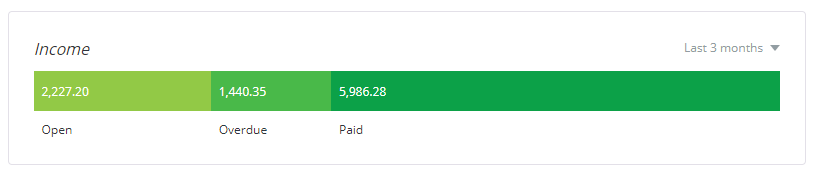
This graph allows you to instantly see the balance of your unpaid, paid, and overdue invoices for the time period that you choose from the drop down menu at the top right corner of each graph.
2. Expenses graph
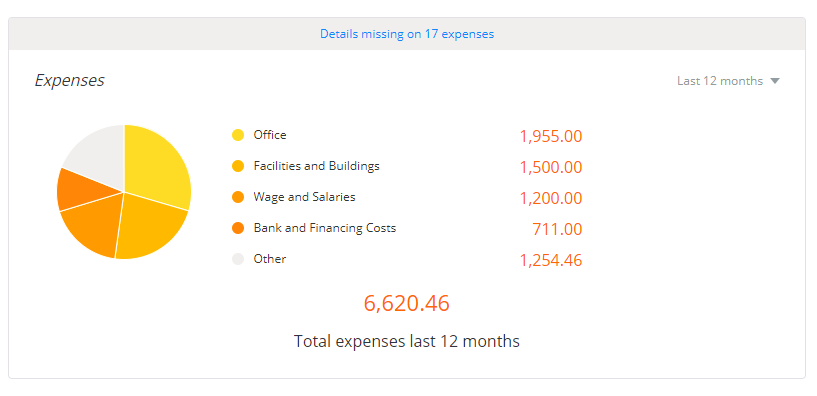
The expenses graph provides you with an overview of the expenses registered in your account for the given time period, breaking them down by category and also giving a total for the time period.
3. Comparison graph
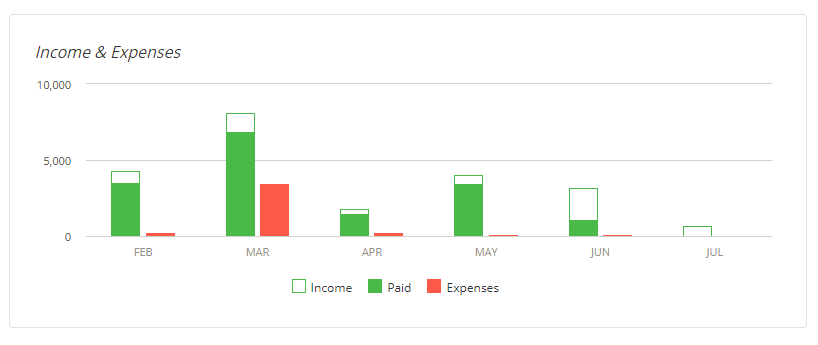
The final graph gives you a view comparing your total for invoices, and what amount has been paid on them, as well as your expenses. The time period for this month is not adjustable but shows a 6-month range.
4. Summary of bank accounts
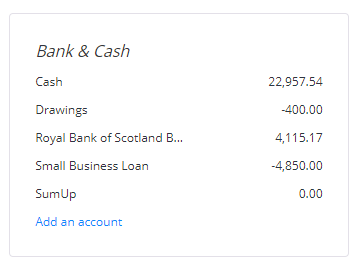
The final graphic that can be added to your dashboard is in fact not a graph, but rather an overview of the bank accounts that you have in your account (including, for example, small business loans). Each account listed also includes the current balance, giving you a quick summary of your totals.
The information you need, at a glance
The graphs on your Debitoor dashboard provide you with quick information about the balances in your accounts. They also give you a visual on how much incoming and outgoing cash flow you have in your business.